Tag: HPC

  • Post-Event Report – 2nd Forum for Supercomputing & Future Technologies

    Services & Applications for Industry and Public Institutions

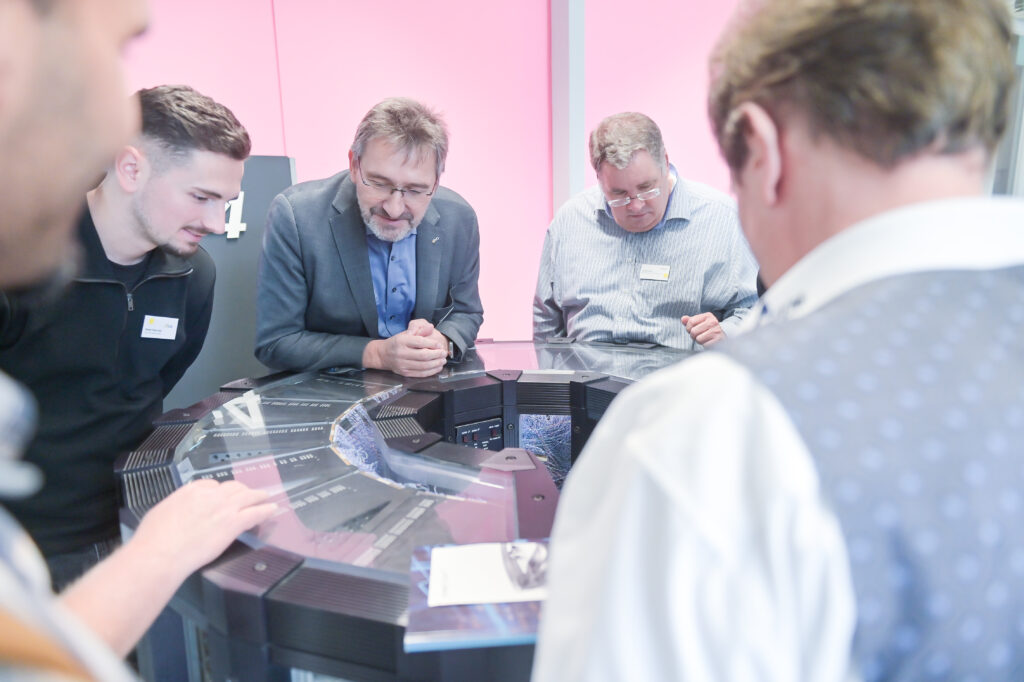
    On October 21, 2025, the High-Performance Computing Center Stuttgart (HLRS) hosted the second Forum for Supercomputing & Future Technologies. Under the motto “Services & Applications for Industry and Public Institutions,” experts from research, industry, and the public sector came together to explore how high-performance computing (HPC) is driving digital innovation and transformation across domains.

    After a warm welcome by Dr. Andreas Wierse (SIDE / SICOS BW GmbH), the day began with industrial use cases highlighting the digital transformation of SMEs. Erwin Schnell (AeroFEM GmbH) opened with „Der Weg ist das Ziel" , illustrating how small and medium-sized enterprises can leverage simulation and HPC to navigate the path toward digital maturity. Dr. Andreas Arnegger (OSORA Medical GmbH) followed with an impressive insight into HPC-assisted therapy planning for bone fracture treatment, showing how computational power directly benefits patient care.

    In another striking example, Dr. Sebastian Mayer and Dr. Andrey Lutich (PropertyExpert GmbH) demonstrated how AI-based image recognition is revolutionizing automated invoice verification – a clear intersection between data science and high-performance computing.

    After a short coffee break, Paul von Berg (Urban Monkeys GmbH / DataMonkey) shared his experience fine-tuning a geospatial LLM on HPC systems, sparking lively discussions among attendees. Daniel Gröger (alitiq GmbH) presented an FFplus-supported project using machine learning for short-term PV power forecasting, followed by Dr. Xin Liu (SIDE / Jülich Supercomputing Centre) , who showcased dam-break simulations and German Bight operation models – tangible examples of HPC applications in the public sector.

    Before lunch, several key initiatives were introduced, including SIDE, FFplus, JAIF, HammerHAI, EDIH Südwest and EDIH-AICS. Together, they illustrated how research, funding, and industry are closely collaborating to enhance digital innovation and technological sovereignty in Germany and Europe.

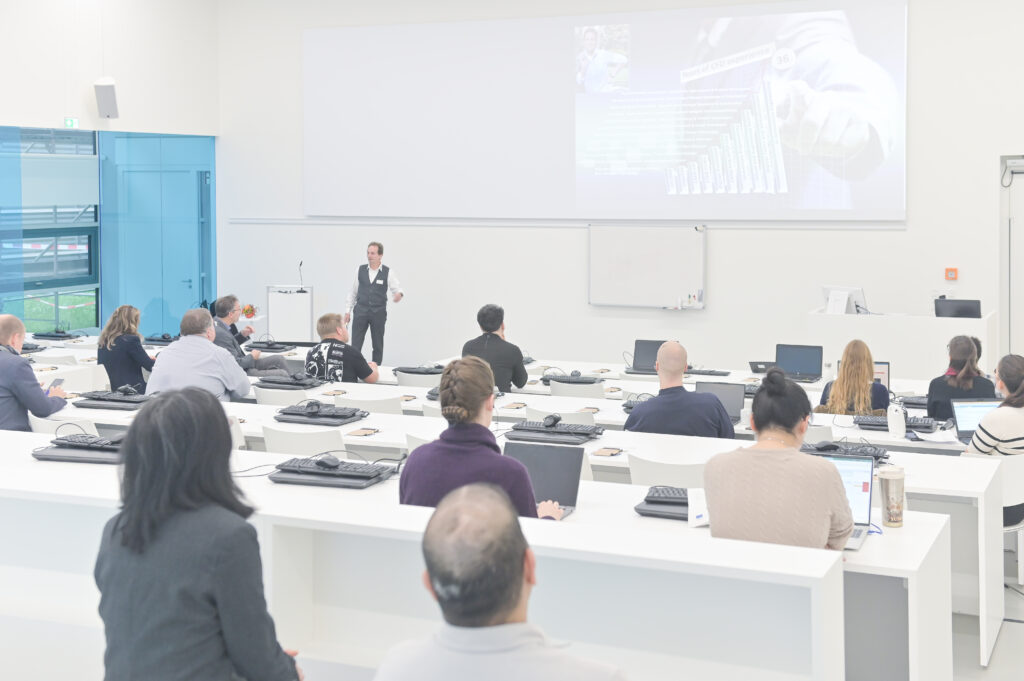
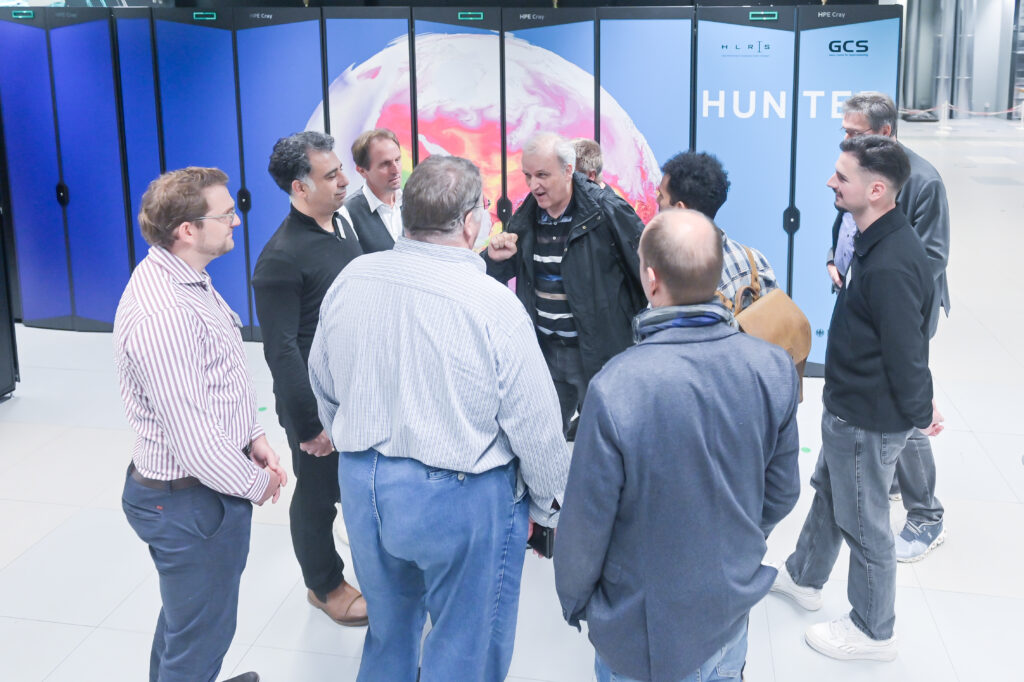
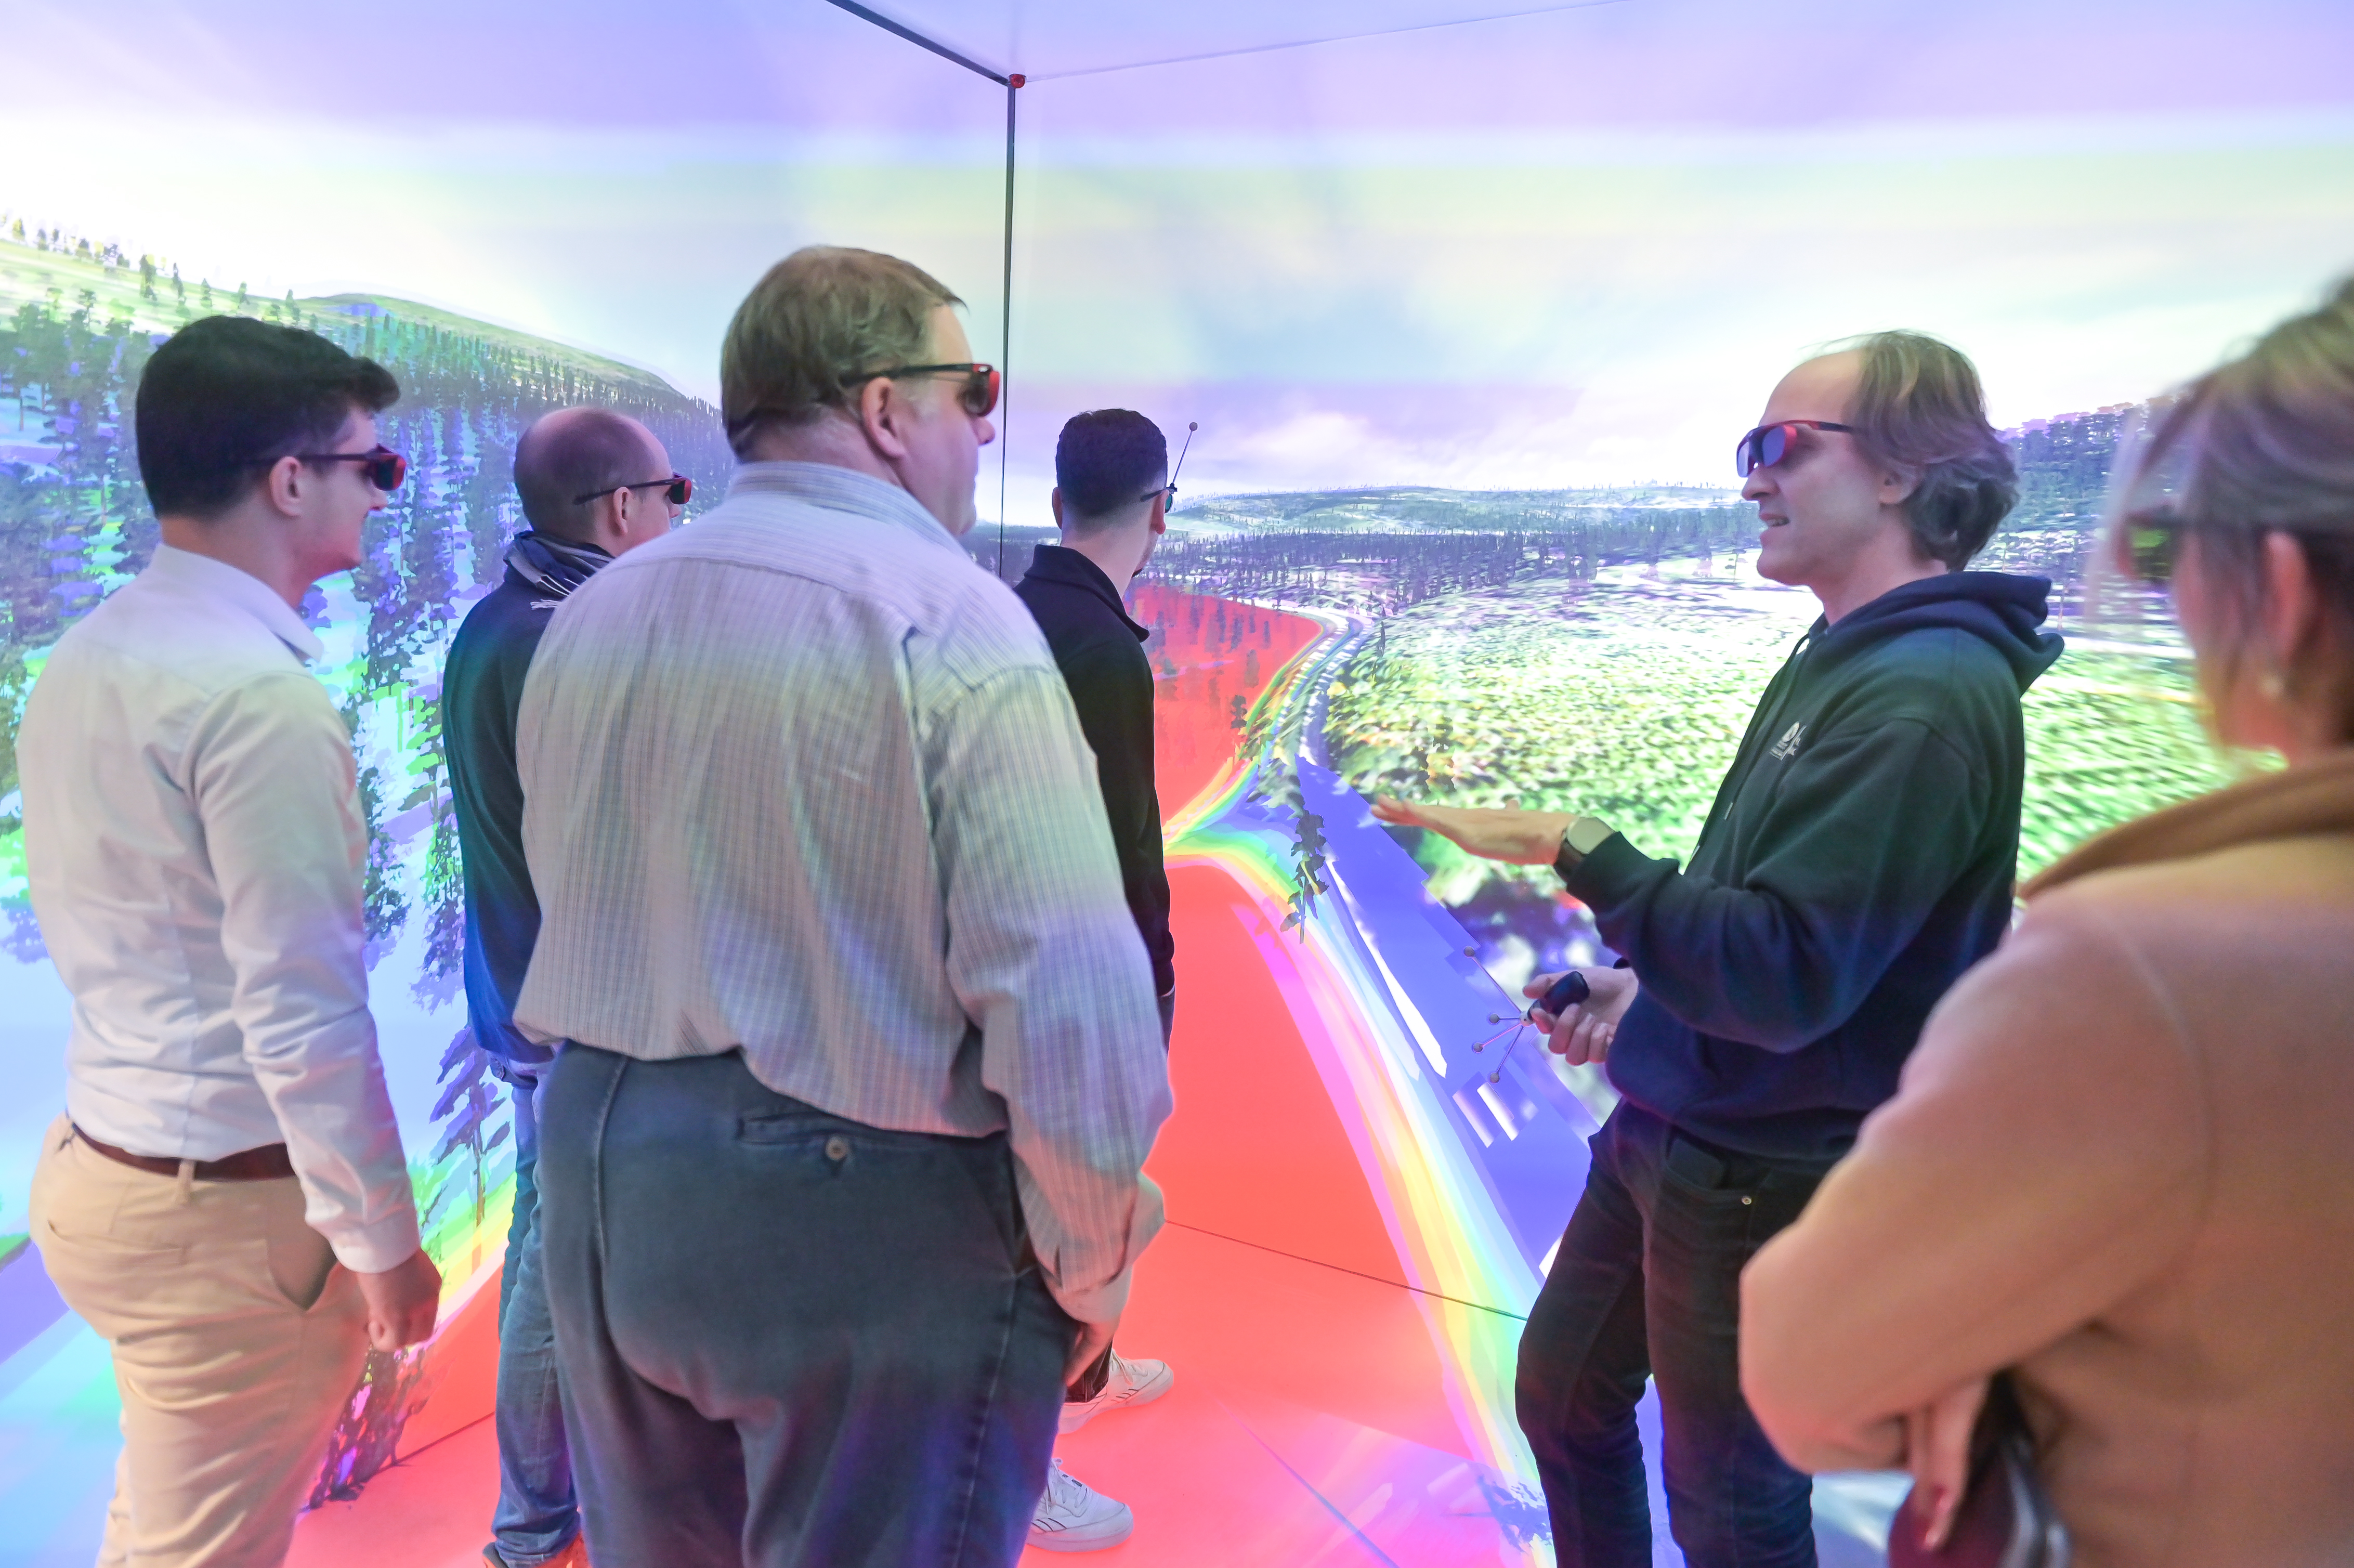
    The afternoon program combined practical experience with networking. Participants could either join Speeddating with HPC, AI, and funding experts or take a data center tour to see HLRS infrastructure in action. Later, sessions included one-on-one expert consultations, a hands-on workshop „How to Use a Supercomputer: The Basics“ by Dr. Maksym Deliyergiyev , and a visualization workshop led by the HLRS Visualization Department, where participants experienced immersive data environments.

    In closing, Dr. Andreas Wierse offered a look ahead to upcoming SIDE and EuroCC activities, emphasizing the growing role of collaboration and accessibility in supercomputing. The forum once again proved that HPC is no longer an exclusive domain of research institutions but a practical tool for innovation in both industry and the public sector.

    The morning program of the second SIDE Forum can now be viewed below.

    Watch video

  • HPC for AI-based trading robots: A success story with Smart-Markets GmbH

    Technical/scientific Challenge

    In the ever-changing financial markets, adaptability and innovation are crucial for sustained success. Smart-Markets GmbH is an SME that develops and offers automated trading robots for medium to long-term stock trading and foreign exchange (forex) Day trading. Since market dynamics change over time, the performance of a trading algorithm diminishes when it is not able to adapt to market changes. Therefore, maintaining continuous effectiveness of the trading robots is one of the major challenges for Smart-Markets, currently requiring continuous back-testing and recalibration of the trading robot algorithms.

    Solution

    To address this challenge, Smart-Markets collaborated with SIDE in a Proof-of-Concept (PoC) study to explore using advanced Machine Learning techniques, specifically Reinforcement Learning, to improve the adaptability of their trading robots. As shown in Figure 1, the robot traded in the EUR/USD stock market. More than 10 years of high frequency tick data, which records every price change in trading, was used for the training and the subsequent test-trading of the agent.

    Figure 2 depicts the results for a simplified scenario, in which no trading fee was applied for the transactions. After an initial random action phase in the first years of trading, where the net worth of 100.000 USD did not significantly change, the agent started making its own trading decisions. Evidently, the predictions of the agent were sufficient to achieve a continuous profit over several years of trading, even in periods of overall negative trends.

    Diagram showing an interaction loop between two labeled boxes. The top box says
    Figure 1: AI agent with reinforcement learning to trade Euro and USD in the stock price.
    Diagram showing an interaction loop between two labeled boxes. The top box says
    Figure 2: Net worth of the trading robot over time (left) and the course of the USD/EUR training data (right).

    Benefits 

    • SIDE helped Smart-Markets leverage HPC resources for processing and analyzing large-scale, high-frequency financial data.
    • The PoC enabled the testing of AI-based trading robots, which could be adapted to changing market conditions within Smart-Markets trading strategies.
    • This PoC serves as a model for exploring broader adoption of advanced computing in the financial sector and beyond.

    Results

    With AI expertise provided by SIDE, this PoC allowed Smart-Markets to explore a new technology without first needing to acquire AI experience. The results show that an AI-based trading robot has the potential to trade profitably over multiple years by dynamically adapting to market changes in real-time. However, within the scope of this project, it was not possible to train a robot that makes a profit in realistic scenarios where a fee is required for each action. To adapt the trading robot to realistic scenarios in the future, the scope of this PoC could be significantly expanded by e.g. incorporating data from several trading prices into the training model.

  • State-of-the-art advancements in quantitative MRI using HPC

    Technical/scientific Challenge

    Quantitative MRI (qMRI) measures underlying MRI parameters, enhancing sensitivity to physiological changes and enabling reliable test-retest comparability, so that observed changes reflect true physiological differences rather than scanner variability. Translating qMRI to UHF, which produces higher-resolution imaging in shorter acquisition times, entails increased field inhomogeneities and specific absorption rate, though. Novel methods developed at INM-4 address these challenges but trigger significantly higher reconstruction complexity and prohibitively long reconstruction times.

    Solution

    To address these prohibitively long reconstruction times, INM-4, in collaboration with the Simulation and Data Lab Neuroscience, optimized its reconstruction code for HPC at JSC. By implementing efficient preprocessing, the reconstruction problem was converted into a slice-by-slice process that could be parallelized. Combined with automated slice processing via bash scripts, this reduced compute time from 320 hours to 8 hours per subject using HPC. This optimized workflow overcame previous limitations, enabling the application of a novel qMRI method that achieves faster scans, improved image quality, and precise parametric estimates. Subsequent measurement of a large cohort confirmed HPC-powered qMRI at UHF as a crucial step toward clinical feasibility.

    Diagramm zur Verbesserung von MRT-Bildern mit einem Supercomputer.
    Figure 1: In accelerated acquisitions, undersampling artifacts degrade image quality. The new qMRI method addresses UHF challenges by acquiring numerous MR images with slightly varying scanner settings. To maintain a short acquisition time, each image is highly accelerated, resulting in severe undersampling artifacts. The reconstruction algorithm corrects these artifacts through extensive computation, requiring a supercomputer. The final output is high-quality, artifact-free images, from which quantitative parameters are estimated.

    Benefits

    • HPC reduced reconstruction time from 320 to 8 hours per subject, making qMRI feasible.
    • The optimised qMRI method enabled faster scans, improved image quality, and more precise parametric estimates.
    • Collaboration with JSC enhanced computational efficiency and set the stage for AI-driven qMRI.
    Vergleichsdiagramm von Gehirn-MRT-Bildern, unterteilt in zwei Hauptabschnitte: Qualitatives MRT (links) und Quantitatives MRT (rechts). Unter „Qualitatives MRT“ gibt es eine Spalte mit drei graustufigen Gehirnabschnitten – axial (oben), sagittal (mittig) und koronal (unten) – die ein Strukturabbild mit willkürlicher Signalintensität zeigen. Eine Graustufen-Skala daneben reicht von -0,5 bis 0,5 und ist mit „Signal Intensity [a.u.]“ beschriftet. Unter dieser Spalte steht: „Structural image with arbitrary signal intensity.“ Der Bereich „Quantitatives MRT“ enthält vier Spalten, wobei jede die gleichen drei Gehirnansichten zeigt, jedoch mit unterschiedlichen Farbcodierungen und Messeinheiten: 1. Die erste Spalte zeigt farbkodierte Bilder von Blau (niedrig) bis Gelb (hoch), welche den „freien Wassergehalt in Prozent“ darstellen. Eine vertikale Skala rechts reicht von 0 bis 100 und ist mit „C_fw [%]“ beschriftet. Die Bildunterschrift lautet: „Free water content in percentage.“ 2. Die zweite Spalte zeigt Bilder in einer Farbskala von Blau/Grün (niedrig) bis Gelb (hoch) für die „Longitudinale Relaxationszeit in Millisekunden“, mit einer Skala von 0 bis 4000, beschriftet mit „T₁ [ms]“. Beschriftung: „Longitudinal relaxation time in milliseconds.“ 3. Die dritte Spalte verwendet eine Farbskala von Blau bis Gelb, um die „Effektive transversale Relaxationszeit in Millisekunden“ darzustellen, mit einer Skala von 0 bis 60, beschriftet mit „T₂* [ms]“. Die Beschriftung darunter lautet: „Effective transverse relaxation time in milliseconds.“ 4. Die vierte Spalte zeigt wieder Graustufenbilder, ähnlich wie beim qualitativen MRT, und stellt die „Magnetische Suszeptibilität in ppm“ dar. Die Skala reicht von -0,10 bis 0,10 und ist mit „χ [ppm]“ beschriftet. Darunter steht: „Magnetic susceptibility in ppm.“ Über den Bildern trennt eine waagerechte Linie die Überschriften: „Qualitatives MRT“ links und „Quantitatives MRT“ rechts. Jede Bilderspalte hat eine kurze, kursiv gedruckte Beschreibung des dargestellten Parameters und der jeweiligen physikalischen Einheit. Das Layout hebt den Kontrast zwischen einem einzelnen MRT-Scan mit willkürlicher Intensität und mehreren quantitativen MRT-Ansätzen hervor, die direkt kalibrierte, numerische Messwerte über die Eigenschaften des Gehirngewebes liefern.
    Figure 2: In vivo results showing a qualitative structural image and quantitative water content map C_W, T_1 map, T_2^* map, and magnetic susceptibility map χ acquired with the QRAGE method.

    Industrial sector

    Health care / Pharmaceuticals / Medical devices, IT/HPC systems

    Scientific partners involved

    Logo mit einem stilisierten blauen Symbol auf der linken Seite und Text auf der rechten Seite. Der Text lautet:JÜLICH ForschungszentrumDas Design wirkt modern und wissenschaftlich.

    The Institute of Neuroscience and Medicine 4 (INM-4) at Forschungszentrum Jülich develops innovative methods to advance diagnostics and improve our understanding of the brain with state-of-the-art medical imaging technology, including ultra-high-field (UHF) 7T MRI. Its interdisciplinary approach in close collaboration with JSC leverages cutting-edge computational resources to develop novel imaging methods for visualizing new biomarkers at higher resolutions in shorter acquisition times.

    Scientific impact

    Implementing qMRI at UHF required a novel imaging method to address increased field inhomogeneities and specific absorption rate. This method enabled faster scans and improved image quality but required solving a complex reconstruction problem with high computational demands. Using conventional hardware, reconstruction was prohibitively slow—8 hours per slice for 160 slices per subject—delaying evaluation of its clinical potential.

    To overcome this, the team turned to HPC and consulting services at JSC to adapt their software to harness HPC's power. Parallelizing tasks and automating processes reduced compute time from 320 to just 8 hours per subject, making it feasible to apply the novel qMRI method, which had been constrained by slow reconstruction.

    HPC thus enabled the method’s practical use, improving image quality and parametric accuracy. This brings qMRI at UHF closer to clinical application, enhancing diagnostics. Further optimization—such as AI-driven image reconstruction—could eventually make it viable in routine clinical settings without direct HPC access, benefiting patients through more precise and timely diagnostics.

    Read more

    • „(ISMRM 2023) QRAGE – Multi-Echo MPnRAGE and Model-Based Reconstruction for Quantitative MRI of Water Content, T1, T2* and Magnetic Susceptibility at 7T“. Zugegriffen: 1. Oktober 2025. [Online]. Verfügbar unter: https://archive.ismrm.org/2023/1091.html
    • M. Zimmermann u. a., „QRAGE—Simultaneous multiparametric quantitative MRI of water content, T1, T2*, and magnetic susceptibility at ultrahigh field strength“, Magnetic Resonance in Medicine, Bd. 93, Nr. 1, S. 228–244, Jan. 2025, doi: 10.1002/mrm.30272.
  • 2. SIDE Forum

    2. SIDE Forum

    Erleben Sie, wie HPC und KI Ihre Innovation beschleunigen können – beim 2. SIDE Forum am 21. Oktober 2025!
    Sie sind Teil eines KMU, Start-ups, Industrieunternehmens oder einer öffentlichen Einrichtung und möchten Ihr Innovationspotenzial mit High Performance Computing (HPC), Datenanalyse oder Künstlicher Intelligenz (KI) steigern? Dann ist das 2. SIDE Forum – Supercomputing in Deutschland genau das Richtige für Sie! Entdecken Sie, wie diese leistungsstarken Technologien Ihnen helfen können, komplexe Herausforderungen zu lösen, Prozesse zu optimieren und sich fit zu machen für die Zukunft.
    Veranstalter ist Supercomputing in Deutschland (SIDE) – das nationale Kompetenzzentrum für HPC, HPDA und verwandte Technologien. Das Forum bringt Technologieexpert:innen, Förderprogramme und praktische Unterstützungsangebote zusammen, die Ihnen den Einstieg erleichtern oder den nächsten Wachstumsschritt ermöglichen.
    Was erwartet Sie?
    Am Vormittag erhalten Sie Einblicke in:
    • Praxisnahe Anwendungsbeispiele und Erfolgsgeschichten von Unternehmen und Institutionen, die bereits HPC und KI einsetzen

    Am interaktiven Nachmittag haben Sie die Möglichkeit, direkt mit SIDE-Expert:innen in Kontakt zu treten – durch:
    • Speed-Dating: Kurze 1:1-Gespräche, um die passenden Ansprechpartner zu finden

    Ob Sie neu im Thema HPC sind oder bereits den nächsten Schritt planen – das SIDE Forum bietet Ihnen praxisnahe Orientierung, Zugang zu Fördermöglichkeiten und Expertenunterstützung – alles an einem Ort.
    👉 Nutzen Sie diese Chance, das Potenzial von HPC und KI für Ihre Organisation zu erschließen. Seien Sie dabei und erfahren Sie, wie SIDE Sie auf Ihrem Weg unterstützen kann.
    Die Anmeldung ist jetzt möglich!

    📅 21. Oktober 2025, 9:00-17:00 Uhr
    📍 HLRS Stuttgart, Nobelstraße 19, 70569 Stuttgart
    🤝 2. Forum für Supercomputing in Deutschland
    📑 Aktuelle Agenda

  • webDO3SE: An Unprecedented Tool for Measuring the Global Impact of Tropospheric Ozone on Plant Life

    Technical/scientific Challenge

    Ozone, a protective compound in earth’s stratosphere, also occurs in the lowest layer of our atmosphere, the troposphere. Tropospheric ozone, though, is harmful to the climate, human health, and vegetation by reducing biomass, harvests, and biodiversity. Quantifying its global uptake by plants is crucial but challenging because it requires numerical modelling that correlates fine-resolution ozone measurements, plant specifics, and meteorological parameters, which are only available for individual sites and limited time periods, making quantification impractical and meaninglessly fragmented.

    Solution

    The TOAR data infrastructure solves the problem of fragmented data. It couples the TOAR database, which is hosted at JSC clouds and contains one of the world's largest collections of ground-based ozone measurements, with the meteocloud, a collection of meteorological data also at JSC, as inputs to the ozone deposition model DO3SE. The workflow of webDO3SE is shown in Figure 1. Via a web interface, users can easily access the data and perform impact estimates themselves in their browser. They select a site and a species by REST query to webDO3SE. Then, all the parameters and inputs needed to run the model are automatically gathered on-line. The model output is then provided to the user directly in the browser for further analysis.

    Flowchart illustrating a data processing workflow within a DO3SE web application. The process begins with a yellow box labeled "REST query, run specifications," leading to a green box labeled "Raw, hourly data," which is connected to "TOAR-DB" below. The flow continues to "Preprocessing," then to "Hourly input." Above "Hourly input" is a box labeled "Parameters," receiving inputs from "growing season," "parameterizations," and "basic station info." The flow proceeds to "Model run," associated with "FORTRAN model" below, and then to "Post processing." The final step is a yellow box labeled "Fast API output." The entire sequence is enclosed within a larger box labeled "DO3SE web application."
    Figure 1 Scheme describing the productive workflow of webDO3SE, which is triggered by a user REST request. The model pipeline then runs automatically on JSC's cloud infrastructure and the results are displayed in the user's browser.

    Benefits

    • Tor data combined with HPC resources and the meteocloud facilitates access to an unprecedented scope of tropospheric ozone data.
    • WebDO3SE provides a unique interface for researching tropospheric ozone impact on vegetation.
    • Studying tropospheric ozone at a global level empowers environmental agencies.

    Industrial sector

    Agriculture, Environment/climate/weather, Public services/Civil protection

    Scientific partners involved

    "TOAR" in großen, fettgedruckten Buchstaben oben. Darunter in kleineren Buchstaben: "tropospheric ozone assessment report". Der Text ist zentriert und verwendet eine einfache, serifenlose Schriftart. "TOAR" ist in dunkler Farbe, während der restliche Text in einem helleren Blauton gehalten ist.

    The Tropospheric Ozone Assessment Report (TOAR) is an international activity under the International Global Atmospheric Chemistry project, which aims to assess the global distribution and trends of tropospheric ozone and to provide data that are useful for the analysis of ozone impacts on health, vegetation, and climate. The TOAR data centre provides access to the TOAR database, which compiles air quality monitoring data from thousands of sites around the world.

    Scientific impact

    As climate change progresses, the greenhouse gases and compounds that beget tropospheric ozone will also likely increase. Historically, studying the far-ranging impacts of tropospheric ozone on food security, carbon sequestration, timber production, and protection against soil erosion, avalanches, and flooding has been hindered by fragmented access to data. Nevertheless, HPC infrastructure combined with TOR data mitigates that fragmentation and enables the scaling of scientific studies to support public entities.

    The TOAR tool, webDO3SE, is currently being used for a global deposition model intercomparison study and will in the future provide an unprecedently global assessment of ozone deposition of vegetation – the extent to which plants absorb and mitigate tropospheric ozone. Once webDO3SE is well established, it can also be used by environmental agencies to estimate tropospheric ozone-related crop damage and other negative impacts on vegetation. Over time the impacts of tropospheric ozone as well as any mitigation policies can be measured, tracked, and more accurately modeled to maximize future environmental and societal benefit.